
SharePoint 2010 Debugging
This one always gets me… There’s a few things that need to be done in order to better debug SharePoint.
- Custom Errors Off
- Enable Call Stack Trace
- Debugging Mode
- ASP.Net Tracing
…and the big one.
- Multiple web.config files.
OK, to break it down. First, know what Web Application you want to debug. This might sound silly but I’ve been caught out a few times with a couple of (not straight forward) sp farm setups.
SharePoint web.config files
Make sure you are looking at the right Virtual Directory. Also, as mentioned as the last bullet, there are multiple web.config files that might need modifying. Below is a scrape from a good articleby Daniel on blogspot (thanks)
The web.config files are genearally found in the following locations:
- web.config file in the root folder of each virtual server / IIS Application.
Local_Drive:\Inetpub\wwwroot
This is the usually the file that contains most of the web configuration of a SharePoint site collection. To display full errors you would need to modify this web.config file. There may be one for each of the SharePoint applications running in some cases (MySites, Multiple Portals or Instances of SharePoint, Central Admin, etc.). If this is the case, you will only need to modify the web.config file which is in the root of the virtual directory for the instance of SharePoint which you using. To find out which directory is used by various SharePoint applications/websites, view the properties of the SharePoint website in IIS and from the "Home Directory" tab, the value in the "Local path" field will take you to the directory where the web.config file is for the specific instance of SharePoint / Application in IIS.

This is the usually the file that contains most of the web configuration of a SharePoint site collection. To display full errors you would need to modify this web.config file. There may be one for each of the SharePoint applications running in some cases (MySites, Multiple Portals or Instances of SharePoint, Central Admin, etc.). If this is the case, you will only need to modify the web.config file which is in the root of the virtual directory for the instance of SharePoint which you using. To find out which directory is used by various SharePoint applications/websites, view the properties of the SharePoint website in IIS and from the "Home Directory" tab, the value in the "Local path" field will take you to the directory where the web.config file is for the specific instance of SharePoint / Application in IIS.

- web.config file used in Web Part resources for the Global Assembly Cache (GAC)
Local_Drive:\Program Files\Common Files\Microsoft Shared\Web Server Extensions\wpresources
- web.config configuration file(s) for extending other virtual servers
Local_Drive:\Program Files\Common Files\Microsoft Shared\Web Server Extensions\60\CONFIG
- web.config file which defines configuration settings for the /_vti_bin virtual directory
Local_Drive:\Program Files\Common Files\Microsoft Shared\Web Server Extensions\60\ISAPI
- web.config file which defines configuration settings for the /_layouts virtual directory
Local_Drive:\Program Files\Common Files\Microsoft Shared\Web Server Extensions\60\TEMPLATE\LAYOUTS
- web.config configuration file for Central Administration pages.
Local_Drive:\Program Files\Common Files\Microsoft Shared\Web Server Extensions\60\TEMPLATE\ADMIN\Locale_ID
Now that you know what config files to modify, here are the key parts that need modification.
Custom Errors Off
Set the customErrors mode to "Off"
Find:
<system.web> ...<customErrors mode="On" />
Change To:
<system.web> ...
<customErrors mode="Off" />
Find:
<system.web> ...<customErrors mode="On" />
Change To:
<system.web> ...
<customErrors mode="Off" />
Enable Call Stack Trace
Set the CallStack value of the SafeMode element to "true"
Find:
<SharePoint>
<SafeMode ... CallStack="false" ... >
<SharePoint>
Change To:
<SharePoint>
<SafeMode ... CallStack="true" ... >
</SharePoint>
Find:
<SharePoint>
<SafeMode ... CallStack="false" ... >
<SharePoint>
Change To:
<SharePoint>
<SafeMode ... CallStack="true" ... >
</SharePoint>
Debugging Mode
Set batch and debug to "true"
Find:
<compilation batch="false" debug="false">
Change To:
<compilation batch="true" debug="true">
Find:
<compilation batch="false" debug="false">
Change To:
<compilation batch="true" debug="true">
ASP.Net Tracing
Include the following line in the <system.web> element of the web.config file.
<system.web> ...
<trace enabled="true" pageOutput="true"/>
<system.web> ...
<trace enabled="true" pageOutput="true"/>
Debugging Share point controls (User
control, Event hander or web part) from
Visual Studio 2010
control, Event hander or web part) from
Visual Studio 2010
Most of you probably already have figured this out, but for those of you who still have not, here is how you can debug your web part in Visual Studio 2010:
- Deploy your Web Part
- Add the Web Part to Page
- In your code, create a break point.
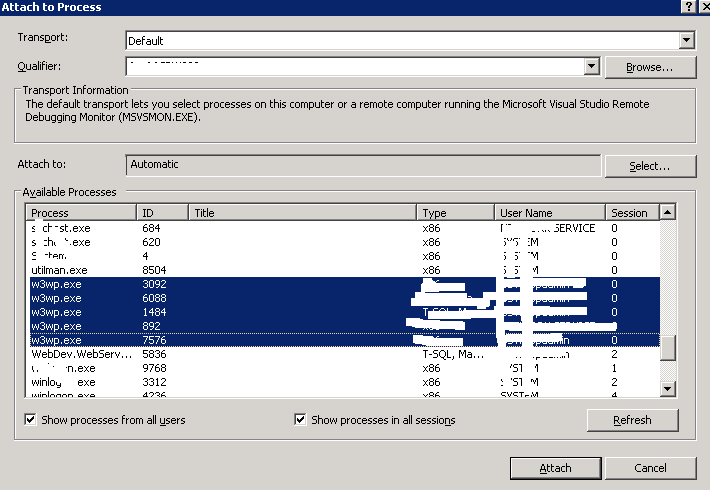
- Go to “Debug” menu, and choose “Attach to Process”.
- Under “Attach to:” section, click on “Select …” button.
- Uncheck all options, checking ONLY “Managed (v2.0, v1.1, v1.0) code”.
- Check the “Show processes in all sessions” checkbox.
- Select all “w3wp.exe” Processes, then click on the “Attach” button.
- Run your page that contains the Web Part. You should now hit your break point, and will be able to step through your code.
Or
I think this is worth enough to show how to debug share point controls (User control, Event hander or web part). It will reduce your time on finding out the issue.
1. First you have to build the application and put your DLL in GAC or BIN folder of your web application
2. Then you have to put that web part in share point. If it an event handler you have to register it
3. Then you have to make a break point in the code where you want to break the code for debugging(Please make sure the current version of the code and the dll you placed in BIN or GAC are same)
4. Then you have to go to Debugïƒ Select Attach to process

7.. Make an IIS reset in the share point server and refresh your page where you deployed your web part.
8. Now when the web part loads you can see it is stopped on the section where we added the break point
9. Now you can debug the share point web part as normal as you debug In ASP.Net
5. From the next screen you have to select all the W3wp.exe process
6. Click Attach
To debug a feature receiver in Visual Studio 2010:
1. Open the Visual Studio 2010 project that contains your feature.
2. In Solution Explorer, right-click the project node, and then click Properties.
3. On the SharePoint tab, in the Active Deployment Configuration drop-down list, click No Activation.
4. Then attach to the w3wp.exe process that is running your particular SharePoint instance.(However,

Also, if you’re looking for a easy to debug an event receiver without having to manually attach a debugger to your code,

Remark: If your workflow contains a delay activity, you will have to attach the owstimer to debug it once
1. First you have to build the application and put your DLL in GAC or BIN folder of your web application
2. Then you have to put that web part in share point. If it an event handler you have to register it
3. Then you have to make a break point in the code where you want to break the code for debugging(Please make sure the current version of the code and the dll you placed in BIN or GAC are same)
4. Then you have to go to Debugïƒ Select Attach to process
7.. Make an IIS reset in the share point server and refresh your page where you deployed your web part.
8. Now when the web part loads you can see it is stopped on the section where we added the break point
9. Now you can debug the share point web part as normal as you debug In ASP.Net
5. From the next screen you have to select all the W3wp.exe process
6. Click Attach
How to: Debug a Timer Job
Debugging Custom SharePoint Timer Jobs
When you create a timer job for SharePoint 2010, you cannot directly press F5 to debug your code. Instead,
you must attach the debugger to the SharePoint 2010 Timer process (Owstimer.exe). This how-to topic
describes how to debug a timer job by attaching the Visual Studio debugger to the timer process.
Steps to debug a timer job in Visual Studio 2010


Steps to debug a timer job in Visual Studio 2010
- On the Start menu, point to Administrative Tools, and then click Services.
- In the Services window, make sure the SharePoint 2010 Timer service is started(You can also restart this service to make the changes reflect in sharepoint server).
- In your Visual Studio 2010 project that contains your custom timer job,set the break point at the first line of Execute() method.
- Note Make sure that the code has not changed since you deployed the timer job; otherwise, the debugger will not match your source code to the deployed assembly.
- On the Debug menu, click Attach to Process.
- In the Attach to Process dialog box, click OWSTIMER.EXE, and then click Attach.
- In the SharePoint Central Administration Web site, click Monitoring, and then click Review job definitions.
- Click the name of your job, and then click Run Now on the Edit Timer Job page.
- Verify that the Visual Studio 2010 debugger stops execution on your breakpoint.
- Happy Debugging.
If the above steps didn't work properly then try the below steps,
- Insert an always-failing assertion statement at the beginning of the
Executemethod. You should useDebug.Assert(false)rather thanTrace.Assert(false)since debug calls are detached from the release builds; then you don’t have to remove them from your code before moving to staging or production.

- Every time the timer job starts, you will get a pop-up window like the one shown in Figure 12. This window hinders the execution of the timer job until you close the message box. Note that timer jobs run in parallel, so this window will never halt the execution of other timer jobs running simultaneously. For now, leave this window alone.
- You might be wondering why you should insert the assert statement at the beginning of the Execute method of the timer job. It is true that you can just attach a debugger to owstimer.exe and wait for the subsequent cycle of the timer job, but it could be tough to find out whether the application has been effectively attached to the process since the jobs may not fire for several minutes. You could be left with Visual Studio attached to the owstimer.exe process with breakpoints set and wondering whether the job is running or wondering whether the breakpoints are not being hit because of some problem with loading the symbol files(.pdb).By adding the following code to the Execute method, you will see your timer jobs running.
- Any time you update your custom timer job class and deploy the assembly to the global assembly cache, you mustrestart all the timer services in the farm. If you don’t restart the timer service, it will run the old copy of your timer job class. Yes, the timer service caches the assemblies. Restarting the SharePoint timer service is the only way to refresh the assembly cache and force it to use your updated assembly.
- And follow the same steps again as mentioned above.
- Happy Debugging.
OR
Steps
To debug a timer job in Visual Studio 2010
- On the Start menu, point to Administrative Tools, and then click Services.
- In the Services window, make sure the SharePoint 2010 Timer service is started.
- Open the Visual Studio 2010 project that contains your timer job.
- Set a breakpoint in the Execute method of your job definition class.
.png")
- On the Debug menu, click Attach to Process.
- In the Attach to Process dialog box, click OWSTIMER.EXE, and then click Attach.
.png")
- If the Attach Security Warning dialog box is displayed, click Attach.
- In the SharePoint Central Administration Web site, click Monitoring, and then click Review job definitions.
- Click the name of your job, and then click Run Now on the Edit Timer Job page.
- Verify that the Visual Studio 2010 debugger stops execution on your breakpoint.
.png")
Debug a Feature Receiver in VS 2010
To debug a feature receiver in Visual Studio 2010:
1. Open the Visual Studio 2010 project that contains your feature.
2. In Solution Explorer, right-click the project node, and then click Properties.
3. On the SharePoint tab, in the Active Deployment Configuration drop-down list, click No Activation.
4. Then attach to the w3wp.exe process that is running your particular SharePoint instance.(However,
I have found that if you need to debug a feature that is activated with stsadm.exe, there is an extra step required.
The reason is that you need to not only attach to the w3wp.exe process but you also need to attach to stsadm.exe as well.).
5. Open the feature receiver class that you want to debug, and then insert a breakpoint. Hit F5 and enjoy!!
6.There is, however a very fast and easy way to start debugging your Feature EventReceiver’s overridden methods, like FeatureActivated() and FeaureDeactivating(): Simply add the following line of code at the point you want to
start debugging:
1
| System.Diagnostics.Debugger.Launch(); |
Debugging Event Receivers in SharePoint 2010
By default event receivers are asynchronous meaning that they run under the SharePoint timer
service (OWSTIMER.exe). This means that the event receivers:
- Are not executed immediately, rather it is scheduled to be executed by OWSTIMER.exe.
- Don’t run under w3wp.exe process anymore, so when you want to debug your event receivers, you have to attach to OWSTIMER.EXE and wait till they are executed.
However, you can control this behavior using the Synchronization attribute:
If you set it to Synchronous, then the event receivers run immediately and under the w3wp.exe
process. So, if your solution depends on event receivers highly and expect the results immediately,
then you have to set it to Synchronous, else setting it to Asynchronous should do the job.
______________________________________________________________________________
you can use the System.Diagnostics.Debugger.Launch() method.
Debugging Custom Application Page Share point
Add it anywhere you want in your code, deploy your solution and begin testing. Before you can begin debugging,
1
| System.Diagnostics.Debugger.Launch(); |
Debugging Custom Application Page Share point
Add it anywhere you want in your code, deploy your solution and begin testing. Before you can begin debugging,
a popup window will appear providing you options where to debug your code, choose an option and begin to
debug your code.
To debug your custom application pages located in layouts folder, perform the following steps:
- In IIS, select your web application and from context menu, select Open. It will display the directory in windows explorer
- Edit Web.config in any text editor (e.g. Notepad)
- In web.config, search for compilation node like “<compilation batch=”
- To enable debugging, update the node as follows
- Set batch=false
- Set debug=true
- After update, your compilation node will become <!– /* Style Definitions */ p.MsoNormal, li.MsoNormal, div.MsoNormal {mso-style-parent:””; margin:0cm; margin-bottom:.0001pt; mso-pagination:widow-orphan; font-size:12.0pt; font-family:”Times New Roman”; mso-fareast-font-family:”Times New Roman”;} @page Section1 {size:595.3pt 841.9pt; margin:72.0pt 90.0pt 72.0pt 90.0pt; mso-header-margin:35.4pt; mso-footer-margin:35.4pt; mso-paper-source:0;} div.Section1 {page:Section1;} –><compilation batch=“false“ debug=“false“>
- Launch Internet Explorer and browse your custom application page
- Now, launch Visual Studio and open your Custom Application Page from layouts directory
- Go to Debug->Attach To Process and attach to w3wp.exe
- Add break points as necessary.
- In Internet Explorer, refresh your page and bingo! you can debug your custom application page now.


Debugging a Project Server Workflow in Visual Studio 2010
After you deploy the workflow project in Visual Studio, on the Debug menu, click Attach to Process.
In the Attach to Process dialog box, check Show processes from all users and Show processes in
all sessions.
Following are considerations to choose the correct process:
- If the workflow creates a project or does another operation that uses one of the Queue methods in the PSI (for example QueueCreateProject), the process uses the Project Server Queue Service. In the Attach to Process dialog box, click theMicrosoft.Office.Project.Server.Queuing.exe processes.
Note: There is a queue process for the application server and for each Project Web App instance. You can attach to all the queue processes, or check the ULS log for the ID of the queue process, and then convert that into a decimal value. For example, if theMicrosoft.Office.Project.Server ID is 0x0FFC in the ULS log, theMicrosoft.Office.Project.Server.Queuing.exe process ID is 4092. - When you submit or restart the workflow, the workflow runs in a w3wp process. Click one or more of the w3wp.exe processes . You can sometimes determine which w3wp process is involved, and find the process ID as in the previous note. Otherwise, attach to all of the w3wp processes.
- If the workflow uses an approval process that includes many approvers, it might run under the SharePoint timer process. Click the OWSTIMER.EXE process . This is not common.
When you attach to the correct process, a breakpoint remains as a solid red dot in the left of the code pane. If you do not attach to the correct process, the breakpoint turns into a hollow red circle with yellow caution indicator, and the tooltip for the breakpoint states, “The breakpoint will not currently be hit. No symbols have been loaded for this document.”
When you click Attach, Visual Studio is ready to catch a breakpoint that you set in the workflow code
If none of the w3wp processes work for debugging, before you attach to a w3wp process, reset IIS, attach to the new w3wp process, and then submit or restart the workflow.
Or
How to Debug a workflow with Visual Studio
As the workflow published on SharePoint run under the IIS process, it is possible to debug via Visual Studio by
attaching the IIS process.
On the Debug menu, select “Attach to Process…”

Tips: If you have many “w3wp.exe” processes running at the same time, to determine which process you have to
debug, you can use this script that gives you some information about the process that can help you.
Under a Dos prompt, type “c:\windows\system32\iisapp.vbs”.

For instance, if your workflow run under port 80, then chose to attach process id=3716.

Attention: Another point to be careful is sometimes, when attaching a process to debug a workflow; your
Visual Studio may crash. If this happen, make sure to manually select the code type to “Workflow”

Remark: If your workflow contains a delay activity, you will have to attach the owstimer to debug it once
the owstimer rehydrate the Workflow instance.
Tip : Debug Sandbox Solution packages in Sharepoint 2010
During development, Visual Studio 2010 automatically builds the solution package, deploys it, and
activates it in the Solution Gallery when you start debugging by pressing F5 but if you want to debug
an already deployed sandboxed solution, you need to attach the SPUCWorkerProcess.exe proccess
manually and hit F5 to debug. See the image below
.bmp)
.bmp)
No comments:
Post a Comment